

The popular web3 data analytics platform, Lookonchain observed a whale withdraw 4 million $ARB tokens from Binance today. Yesterday, Lookonchain also reported that three whales withdrew a total of 3.76 million $ARB from Binance. These exchanges-to-wallet transactions by whales could increase $ARB’s price as the supply continues to reduce. Moreover, whale movements are often observed by various traders and could change the psychological behaviors of the market.
Another whale withdrew 4M $ARB ($5.28M) from #Binance 7 hrs ago.https://t.co/JdMzHzqbhzhttps://t.co/49LEA8bhim pic.twitter.com/uRMI6dMP6e
— Lookonchain (@lookonchain) July 18, 2023
Currently, Arbitrum ($ARB) is trading at $1.29 after a fall of 0.75% in just one day. However, $ARB experienced a double-digit surge of 15.20% over the week and is residing in the green zone of the chart. With a circulating supply of 1,275,000,000 $ARB, its market cap is valued at $1,642,248,366. With recent whale movements, $ARB could also trigger a bullish price movement in 24 hours.
Looking at the 3-hour $ARB/$USDT chart, the candlesticks are currently trading upwards within the regression channel trend. Moreover, the Bollinger Bands are moving upwards confirming that the altcoin could move upwards for some time.
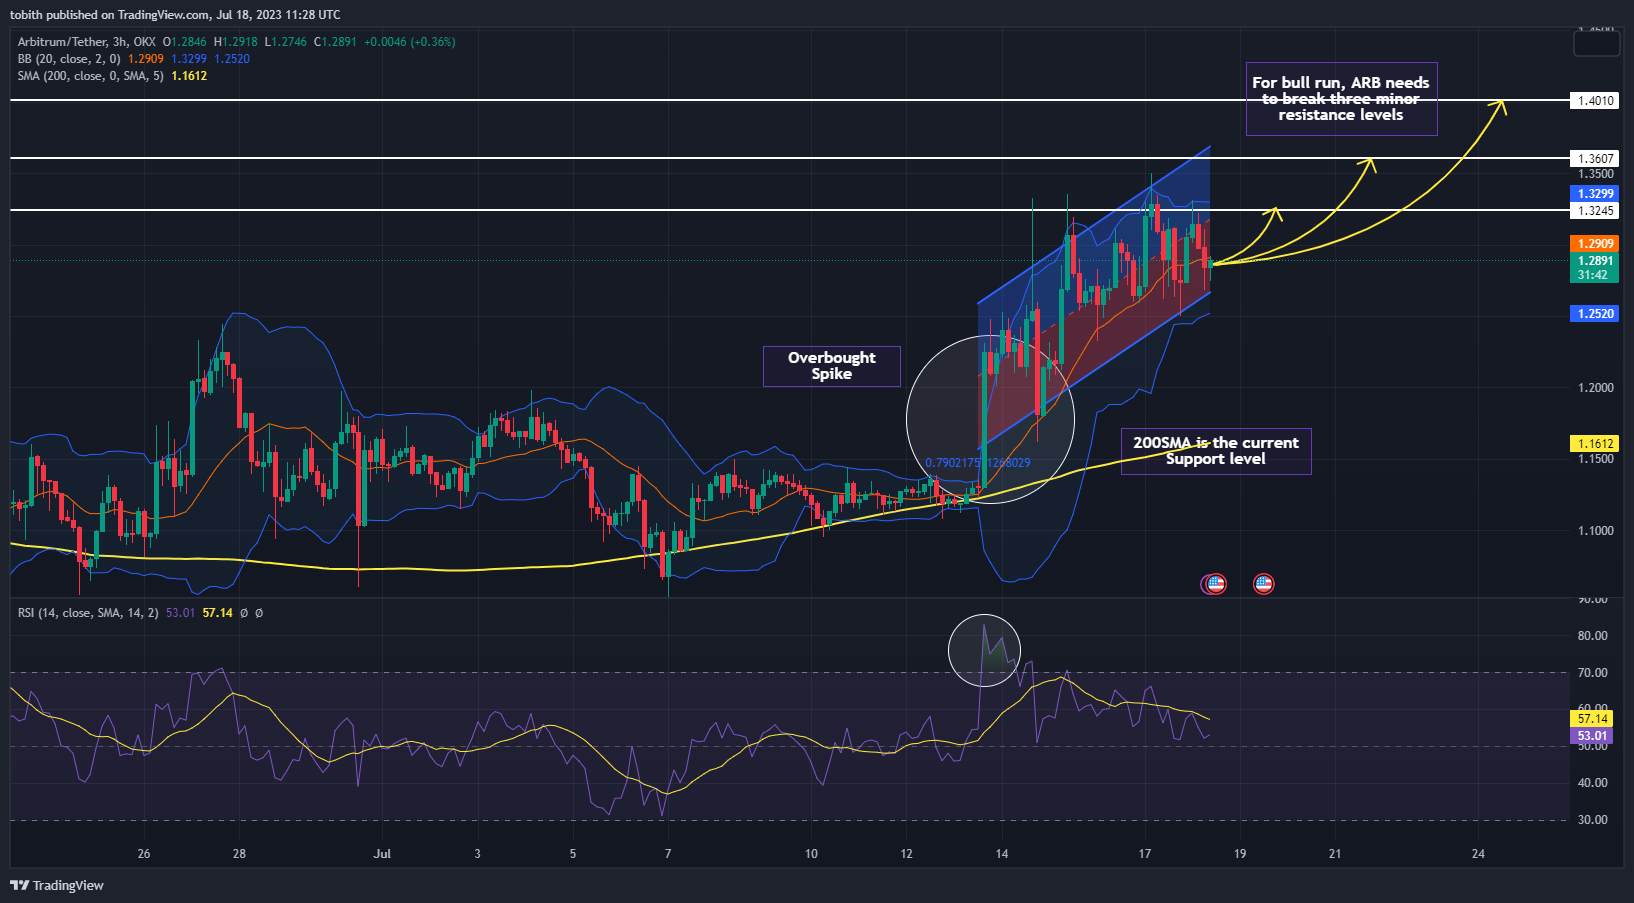
Observing past price actions, $ARB has traded in the three minor resistance levels shown in the chart above. The altcoin is attempting to start a bull run for a long period of time. However, $ARB needs to cross beyond the three minor resistance levels such as $1.324, $1.360, and $1.401 to experience a proper bull run. However, there is still a chance that $ARB may fail in its mission as the candlesticks have not yet crossed any of the minor resistance levels.
Currently, the candlesticks are testing the first resistance level at $1.324 as few candlesticks’ wicks touched the line. Moreover, $ARB is trading in the bottom half of the regression trend, and the Bollinger Band. It is expected that the altcoin could bounce away from the lower bands of these indicators. If the candlesticks begin to trade upwards, then, there is a high chance that it could reach the first resistance level, which could be the first checkpoint for a bull run.
Disclaimer: The views and opinions, as well as all the information shared in this price analysis, are published in good faith. Readers must do their own research and due diligence. Any action taken by the reader is strictly at their own risk, Coin Edition and its affiliates will not be held liable for any direct or indirect damage or loss.


