

 1
1
Bitcoin cash was once again in the red on July 5, as traders continued to secure gains following a recent 15-month high. The token fell for a third straight session, whilst the overall global crypto market cap also slipped on Wednesday. Monero was another notable token to fall in today’s session.
Bitcoin Cash ($BCH)
Bitcoin cash ($BCH) slid by as much as 9% on Wednesday, as traders continued to capture profits following a recent bull run.
The cryptocurrency surged to a 15-month high last Friday, after climbing to a peak at $329.71.
However, the price dropped to an intraday low at $258.17 in today’s session, a day after trading at $281.46.
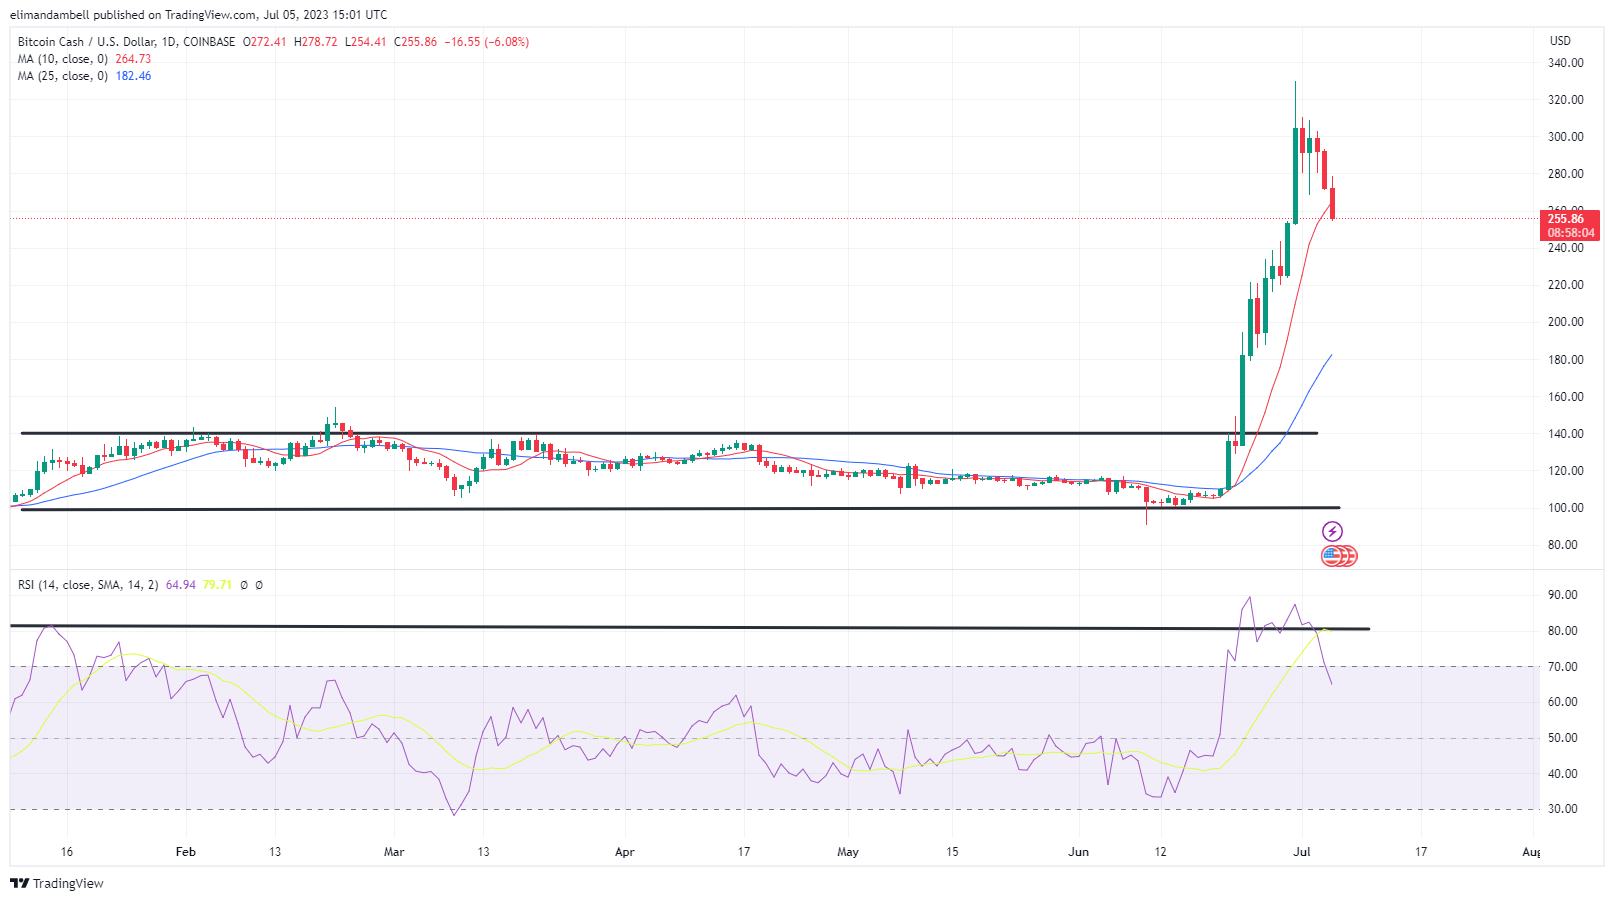
Looking at the chart, $BCH has now dropped for a third straight session, a sell-off which started after the relative strength index (RSI) fell below a ceiling at 81.00.
At the time of writing, the index is tracking at 65.73, which is marginally below a floor around the 66.00 level.
Overall, the decline seems to be a result of profit taking which came once the RSI moved deep into overbought territory.
Monero ($XMR)
Monero ($XMR) was also in the red in today’s session, dropping lower for a second consecutive session.
Following a peak at $169.52 on Tuesday, $XMR/USD moved to a bottom at $161.89 earlier in the day.
The decline comes as the token failed to break out of a ceiling at $173.00 on Monday, after hitting its highest point since February 4.
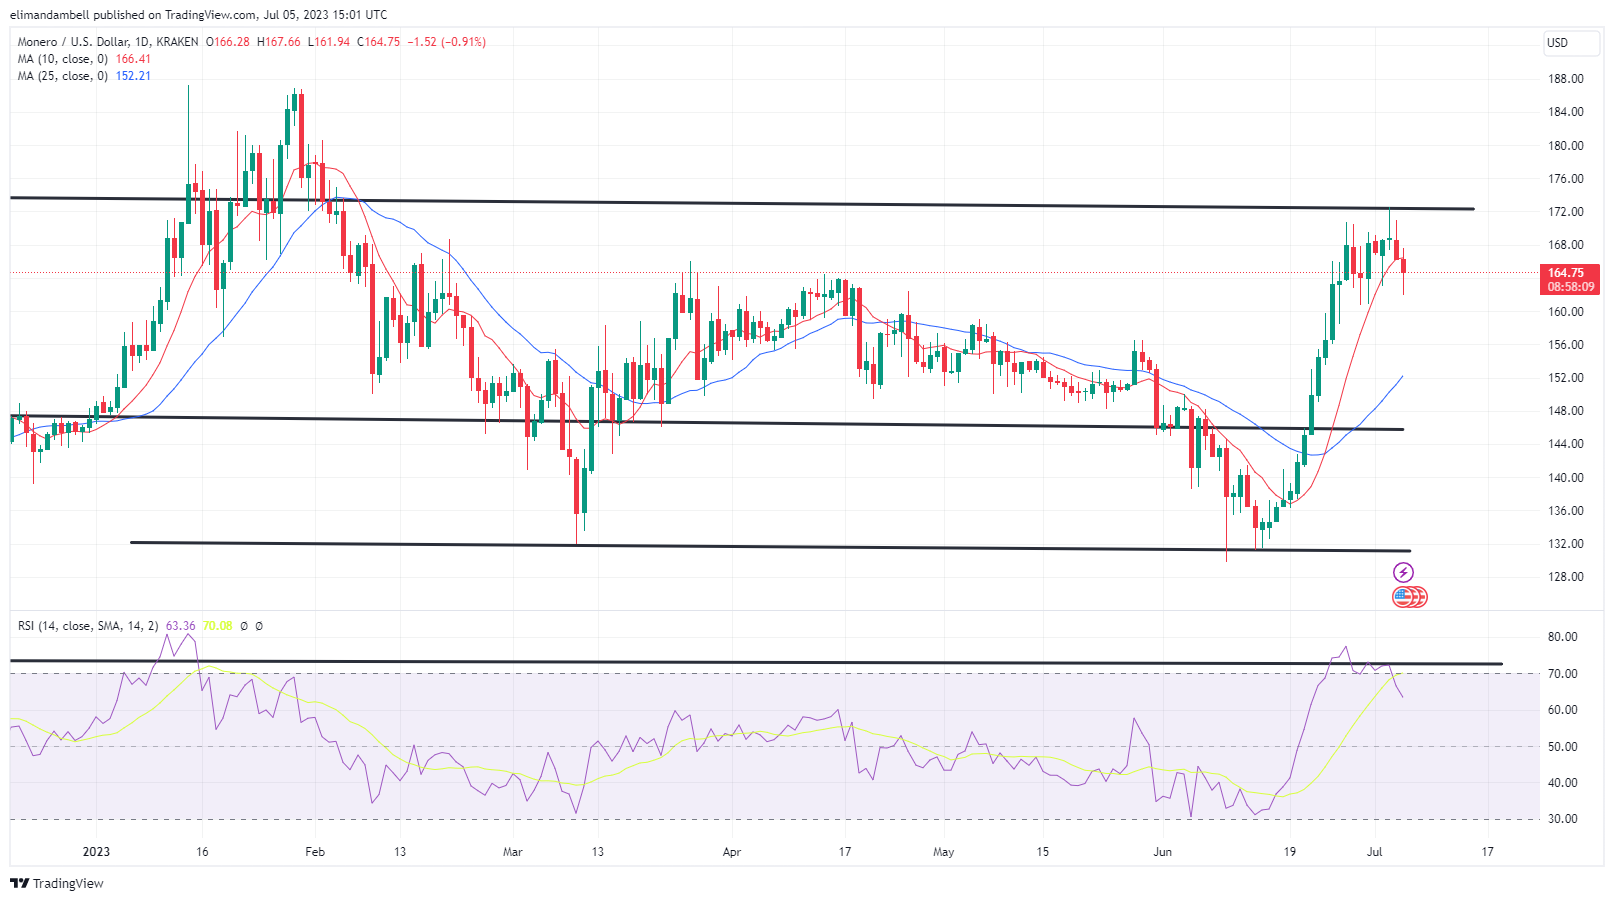
One of the reasons for this was also due to the RSI, which was unable to move past a resistance level of 73.00.
Currently, price strength is now tracking at 63.86, and appears to be headed to a floor at the 58.00 mark.
Should the index move to this floor, there is a possibility that $XMR will drop to $160.00.

