

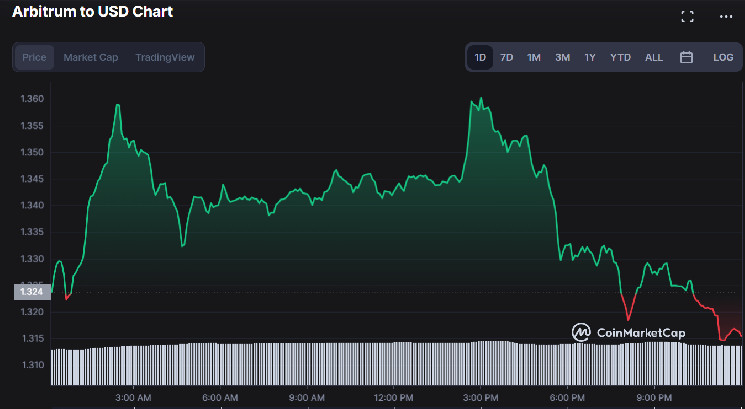
Today’s Arbitrum price analysis is bearish as the altcoin‘s price has been fluctuating between $1.31 to $1.36. The $ARB token has been unable to break above the EMA200 (1.40) and is now heading toward its support level at $1.25. In the past 24 hours, arbitrum’s trading volume has increased significantly to approximately $330,184,640 while the market cap stands at $60,851,386 USD. The $ARB token is currently trading hands at $1.32.
Looking ahead, if the support at $1.25 holds up we could see some bullish momentum in the next few days as buyers try to push the price back up towards its EMA200 (1.40) level. The Arbitrum token ($ARB) has been trading between the exponential moving average (EMA) of 50 and 200 since mid-May, indicating a bearish market sentiment.
$ARB/USD technical analysis on a daily chart: Bears remain adamant in pushing prices lower
Arbitrum price analysis on the daily chart reveals the $ARB token opened the daily trading session at an intraday low of $1.31, a bounce off from yesterday’s low of $1.27.The price then moved higher, reaching a peak of $1.36 before dropping below the EMA50 line (1.32). Since then it has been consolidating at around $1.32, a level where it has remained for the past 12 hours. The Relative Strength Indicator (RSI) has also dropped to 36.25, indicating that bears are still in control at the moment.
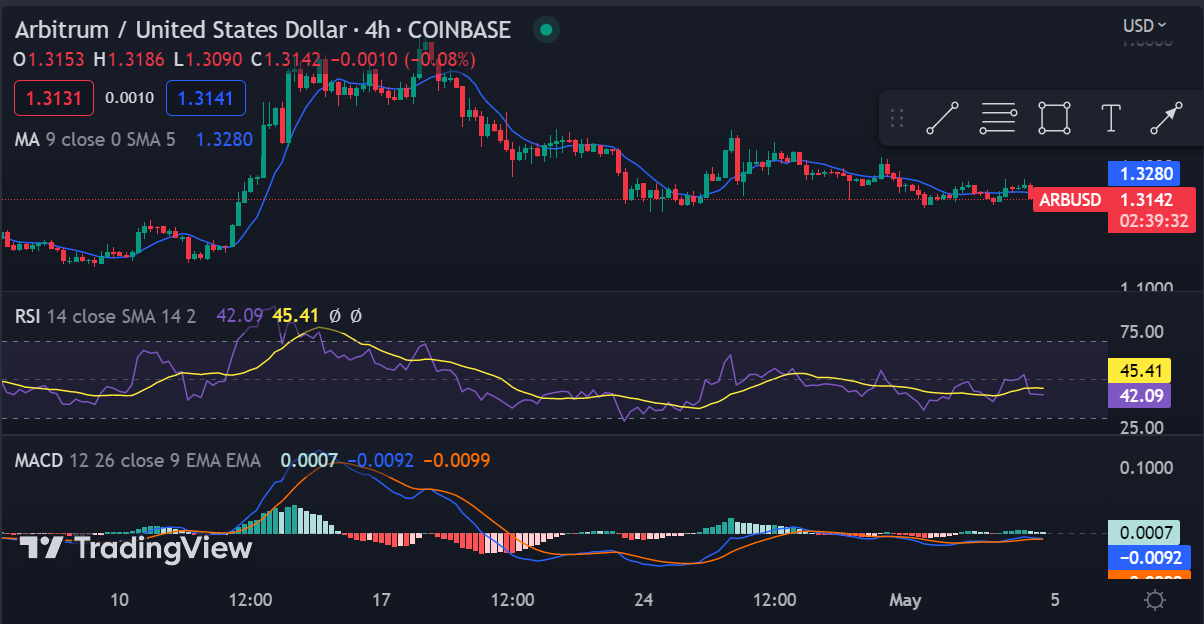
A bearish engulfing pattern can be seen on the chart, indicating a bearish wave may be in play soon. In addition to this, both the MACD and Signal lines have crossed below the zero line, a sign of further bearish pressure.
Using the Fibonacci retracement tool on the daily chart, we can see that the price of Arbitrum has retraced to the 61.8% level from the high of $1.76 to the low of $1.08. The 61.8% level is acting as support, preventing any further losses. However, if the price breaks below this level, the next support level is at the 78.6% level, which is at $1.23. On the upside, the first resistance level is at the 38.2% level, which is at $1.45.
Arbitrum price analysis on a 4-hour chart: Bearish momentum is still in play
Arbitrum price analysis on the 4-hour chart shows the price of Arbitrum has experienced minimum changes, with the price trading within a tight range between $1.31 to $1.35. The Bollinger bands are seen to be narrow, indicating low volatility in the $ARB/USD pair. The MACD and signal lines are both seen to be below the zero line, indicating a bearish momentum.
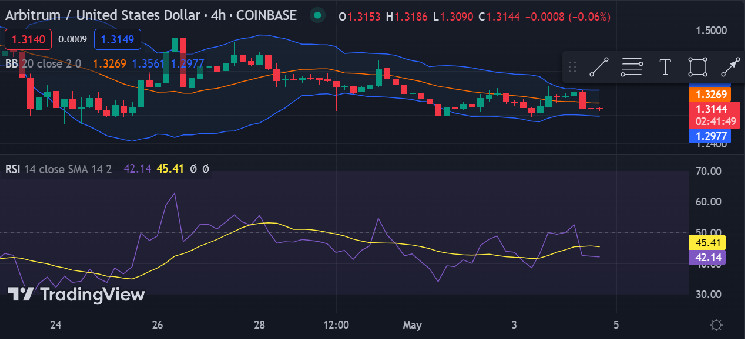
The technical analysis shows the altcoin has formed a descending triangle pattern, with the bears in control of the market. If the price breaks below $1.31, we could see a further drop toward the support level at $1.25. On the upside, if the price manages to break above the upper trend line at $1.40, then we may witness some bullish momentum and the price could reach the next resistance level at $1.50.
Arbitrum price analysis conclusion
The Arbitrum price analysis shows that the $ARB token has failed to break above the EMA200 (1.40) and is heading towards its support level at $1.25. Bears remain adamant in pushing prices lower, with a bearish engulfing pattern seen on the daily chart. The technical analysis suggests $ARB prices are currently in a consolidation phase and may be heading lower soon.


