

 1
1
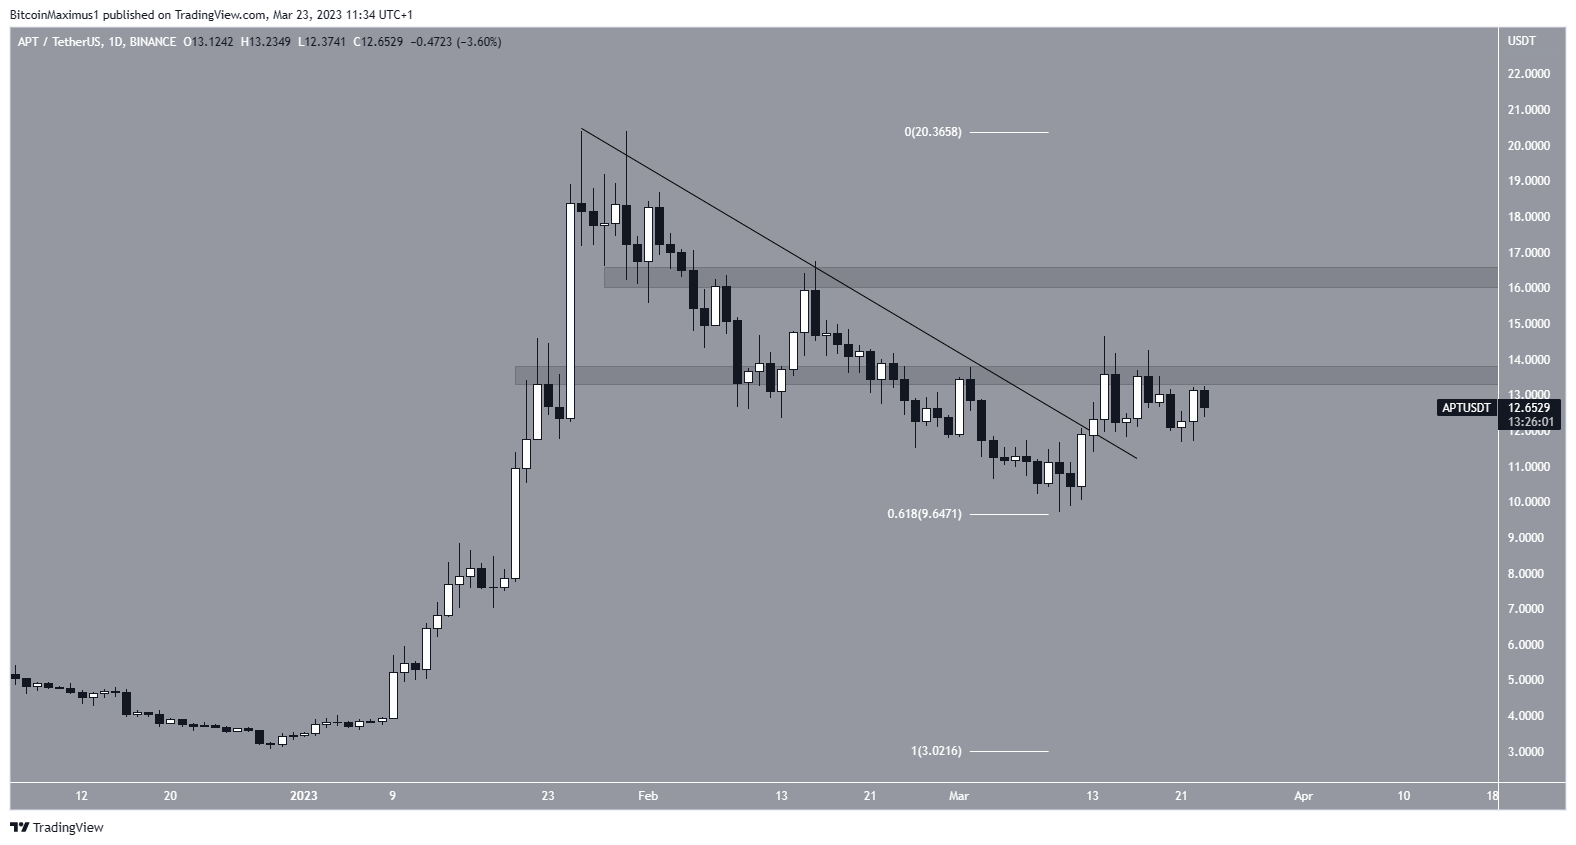
The Aptos ($APT) price seems to have completed its correction and may have begun a new upward movement.
The Aptos price had fallen under a descending resistance line since reaching an all-time high of $20.40 on Jan. 26. The decrease led to a low of $9.70 on March 10.
Afterward, the digital asset bounced, validating the 0.618 Fib retracement support level at $9.65. This was followed by a breakout on March 13, in which the RSI also increased above 50 (green icon) during the next 24 hours.
Despite the breakout, the $APT token price has struggled to move above the $13.60 resistance area. If it successfully moves above it, the price could increase to the next resistance at $16.30.
However, the Aptos price could drop to the 0.618 Fib retracement support level if another rejection occurs at $9.65.
Wave Count Supports Continuation of Increase
Since the beginning of the year, $APT has completed a five-wave upward movement and an A-B-C correction. The bounce at the 0.618 Fib, the nearly 1:1 ratio of waves A and C, and the resistance line breakout all support this possibility.
If correct, the $APT price has now begun a new five-wave upward movement which will take it to a new all-time high and toward $22. A close above $16.30 would confirm this.
However, a decrease below the C wave low (red line) of $9.70 would invalidate this possibility. In that case, the $APT price could fall to the $7.80 support area.
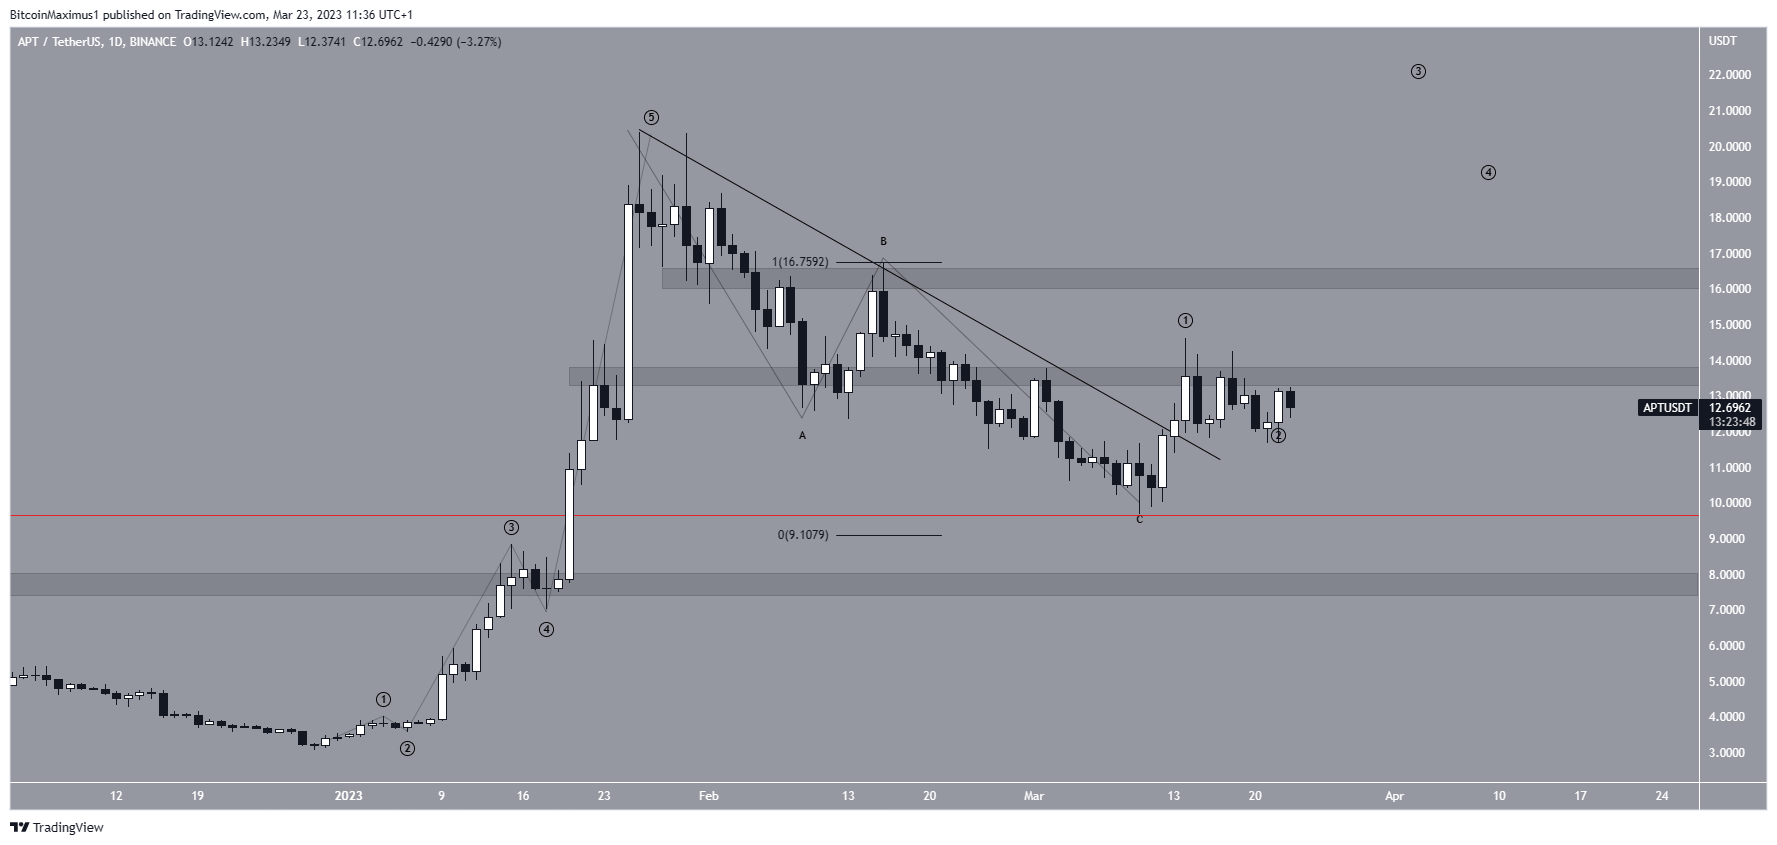
To conclude, the most likely $APT price forecast is the continuation of the increase toward at least a new all-time high and possibly $22. A drop below $9.70 would invalidate this. In that case, the price could fall to $7.80.
For BeInCrypto’s latest crypto market analysis, click here.

