
- The higher highs and higher lows that FET has formed recently indicates that it has entered an uptrend.
- Indicators do not generate any buy signal for coin at the moment.
- A Rounding bottom pattern can be considered as a base for a bullish rally ahead.
The technical analysts may have observed formation of a rounding bottom pattern on daily chart. There is usually a bullish rise after a rounding bottom pattern breakout. The coin displayed a breakout of this pattern earlier but that breakout was not strong enough as the price could not rise much higher.
A Rounding Bottom Pattern is visible on daily chart

On daily chart, the investors might have noticed that coin after giving a breakout of rounding bottom pattern could not continue its bull run and instead it showed a pull back. The coin is presently consolidating at current price levels. After this consolidation, a bull move is expected once again. Apart from this, a Golden Crossover also took place on chart earlier at the support levels which may be one of the reasons of the price increase lately.
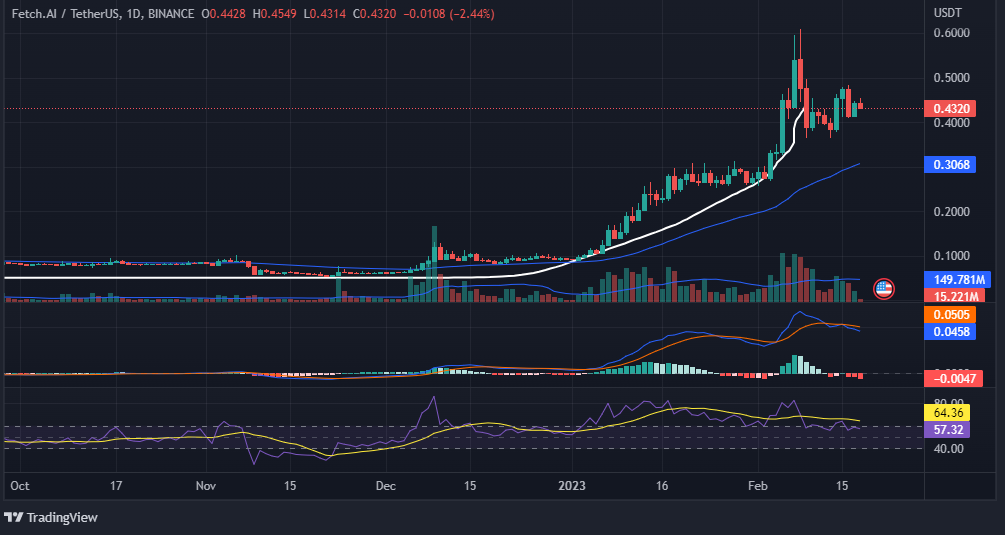
MACD indicator has recently shown a bearish crossover. This bearish crossover suggests that bears have taken command over bulls and as a result of this, investors may see a fall in prices. On other hand, the RSI curve is trading at 57.32 which is over its 50-point threshold but this till cannot be considered as a buy signal because there are chances that RSI curve may decline more in near future and as a result prices of coin may also decline.
Thus, it can be concluded that both the indicators, that is, MACD and RSI are delivering a sell signal.
Will Golden Crossover continue to raise the price of coin?
On the short-term chart, investors may have observed that coin took support at around $0.0631 and traded around these levels for a quite long time. Around December in 2022, a Golden Crossover took place on chart which then drove prices to the current levels. Moreover, a consolidation zone similar to that of the daily chart is also visible on the short-term chart.
Conclusion
Investors must have drawn conclusion that after the current consolidation zone breakout, the coin may give a bull run and a Golden Crossover that has occurred on daily chart may also serve as an additional confirmation to that bull run.
Technical Levels
Resistance levels – $0.4987 and $0.6182
Support levels – $0.2018 and $0.0631